Why Do So Many Kids Have Difficulty Adjusting to School?

Peter Gray MD, writing for Psychology Today back in 2010:

"From an evolutionary perspective, school is an abnormal environment. Nothing like it ever existed in the long course of evolution during which we acquired our human nature. School is a place where children are expected to spend most of their time sitting quietly in chairs, listening to a teacher talk about things that don't particularly interest them, reading what they are told to read, writing what they are told to write, and feeding memorized information back on tests."

We need to be talking more as a society about our perceived need to medicate 12% of boys and 4% of girls to make it through each school day.

Highly recommended reading for anyone working in schools.

It Is Rocket Science

New theories about the science of learning from the Deans for Impact. Interesting findings include:

  • The idea that we each have different learning styles? Unsupported by research.
  • "Research shows that taking a quiz or forcing oneself to recall information is a better practice" than, say, rereading a book chapter or completing a study guide.
  • Peer tutoring? "When we want a student to learn something, have the learners recall what they know and teach someone else instead of sitting with a few peer who already gets it."
  • "Teachers [should] alternate practice with different kinds of content rather than practicing one type of problem several times before moving on."

My sense of this: The better able students are at being agents of their own learning, and the better teachers are at supporting that type of learning, the more students learn.

Allowing Student Choice in Their Daily Schedule: a Technical How-To

This year, using Google Forms and two Add-Ons, I cobbled together a system that allows teachers to account for our 400 high school students during a relatively open 30-minute period of their day. When developing this system, I had two primary objectives:

  1. I wanted students to choose which class they go to for this 30-minutes.
  2. I didn't want to use passes or paper and pencil sign-ups.

I needed to know where students were at and whether or not they attended, but I didn't want students to have to go to one teacher's class for attendance just to leave (as is done in typical seminar-like structures I've seen elsewhere). I find this to be a waste of time and energy.

After some help from the internet and time to tinker, I came up with the following system:

1. Students Register for the Class They Want to Attend

We offer these 30-minute periods, called FIT (for Focused Instructional Time) every Tuesday and Thursday in the middle of the afternoon. Prior to the start of each FIT period, students navigate to this page on our website, click on the name of the teacher who's class they need to focus on, and complete a Google Form letting the teacher know they plan to attend.

For reasons that will become evident in the next step, each of the registration links on this page go to a separate Google Form specific to that teacher's class.

2. Registrations are Capped at Thirty Students Per Class

To prevent some classes from becoming overrun with students, I use the formLimiter add-on by New Visions Cloud Lab. While not perfect, this add-on looks at the spreadsheet where registrations are being recorded and turns off the form once registration levels hit a pre-determined level (in our case thirty students).

3. Students Receive an Automated Email Confirming Registration

Whenever a student successfully registers for a class, they see a message on the screen and receive an email confirming our expectation that they will attend. This email is sent using Google's own Form Notificaitons add-on. It becomes the fall-back receipt in the event of a registration getting lost.

4. Registrations are Captured in a Single Google Sheet

To ensure my entire staff can easily find any student during this 30-minute period, I have set the destination of each of the individual teacher's registration forms to the same Google Sheet. My entire staff needs to have edit rights to this spreadsheet, so I protected all of the cells they shouldn't edit to prevent errors from breaking everything.

5. Teachers Take Attendance Using Registrations

Every Tuesday and Thursday, during this 30-minute period, teachers open up the spreadsheet, navigate to their course tab, and take attendance using the list of students who have registered to be in their class during FIT. If a student who registered is absent, the teacher copies the registration information and pastes it into another tab labeled "Absent." My dean of students checks the absent tab for students who should be present while my instructional coach and a paraprofessional "sweep" the halls looking for students who may have forgotten to register.

6. Once Attendance is Taken, Teachers Delete the Registrations

Within the sheet is a tab containing formulas that count the registrations for each teacher. It is this tab that each registration form looks at to determine whether or not the class is at capacity (30) and the form needs to close. Deleting the day's registrations after attendance is taken resets the count tab value to zero for the course allowing another 30 students to register the next time around.

If a teacher forgets to delete their registrations after taking attendance, then only as many students as seats available will be able to register the next time around before the form automatically shuts itself off. For this reason, deleting student registrations after attendance is taken is a key behavior to ensuring this system works.

The Friday Five

An admirable practice explained well by 4th grade teacher, Justin Birckbichler:

Every Friday, I call five parents. While calling them, I share something great about their student from that week. It could be a concept they worked hard to improve, a great peer interaction, or showing respect to me or another teacher. I do this every Friday without fail.

Breadth vs. Depth: The Deeper Learning Dilemma

Dr. David T Conley, writing for Education Week:

A classroom well balanced between breadth and depth might introduce new concepts on a regular basis and practice them to ensure basic understanding while at the same time have students always working on one project or task that goes deeper in a keystone area. While the majority of class might still be used to introduce, explain, and practice new content, a significant portion of class time might be devoted to projects and tasks focused on keystone concepts, which students would spend considerable out-of-class time on as well.

The key word above is "balanced."

‘Student Agency’ Is Not Something You Give or Take

Andrew Rikard, Junior at Davidson College in North Carolina:

When educators say that I am an equal, even when I clearly am not intellectually, everything changes ... I feel both a sharp fear and an intense freedom. Suddenly, my voice is valuable ... my thoughts can change the mind of the other collaborators. This is empowering. It is the exclamation that we all are learning together.

New Tech GPA Stronger Predictor of College Success

A few weeks ago, I shared that my dual enrollment students' high school GPA was the strongest predictor of college success — stronger even than scores on college placement exams. Last week, it struck me that half the group of students we sent (our juniors) were taught in 100% New Tech courses before dual enrolling in college. The other half were seniors who were taught in traditional classes one year ahead of our New Tech initiative. What a great opportunity for data comparison!

For those unfamiliar with New Tech, let me explain: 

Three years ago, my district contracted with the New Tech Network to support change in our high school in three key areas:

  1. Empowering students through increased voice and choice in their learning.
  2. Engaging students in deeper learning of course content through wall-to-wall implementation of project- and problem-based learning as our instructional model.
  3. Enabling students to foster their own learning by providing them with 1-to-1 technology and teaching them to use it effectively.

As part of this initiative, we spent over 2.5 million dollars renovating spaces, buying furniture and technology, and training teachers and leaders. As a result, our staff is now working collaboratively to design authentic projects. We've moved our teacher desks into one of two "Bullpens" where teachers meet between classes and during prep. We integrate courses whenever integration makes sense. Our students take classes like "GeoDesign," "BioLit," "American Studies," and "Civic Reasoning." Each of these classes have two teachers and more time to learn from their work. We are doing a lot of things differently. And better.

To put things back into perspective, we have two groups of students dual enrolling this year: seniors and juniors. Both were educated by the same teachers in the same school. The juniors are part of our New Tech initiative. The seniors are not. The circumstances are begging for further analysis!

To start, let me describe the students. Last semester, we had 67 students dual enroll: thirty-nine juniors and twenty-eight seniors. Both groups represent what we would consider our "top third" performers (more juniors dual enrolled because their class size was larger). The average high school GPA for the groups were close: 3.39 and 3.32 respectively.

They were also demographically similar. Both groups had a few more boys than girls. They represented only a third of our free and reduced lunch population (only 18% of dual enrolled students vs 55% total high school enrollment). They were racially similar, 99% white, which is consistent with our district and community makeup. 

The one demographic difference that stands out to me is the obvious one: seniors are, on average, one year older than juniors. They also have one more year of high school experience and are one year closer to entering college full-time. While I cannot say that this information is statistically significant, after working in high schools for the past ten years, it feels anecdotally significant.

In college, they also performed similarly when looking at the average. Seniors passed 96% of college classes with a GPA of 3.01. Juniors passed 92% of college classes with a GPA of 2.90. Failure was experienced by just three students, one senior and two juniors.

One other comparison that seems notable is that both juniors and seniors took similar courses in college with one potentially significant exception: being farther ahead in curriculum, more seniors took advanced math than juniors (46% vs 13% respectively). 

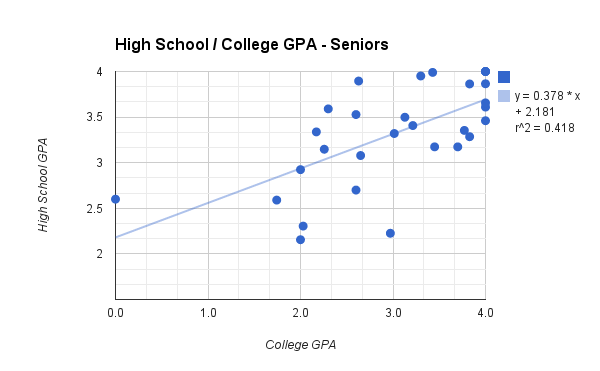
Where performance differences become noticeable is in the way individual GPA distributes across students. The graphs below demonstrate that difference by overlapping the distribution of high school and college GPAs for each group independently.

image (3).png

Generally speaking, it is clear that both groups performed better at the top of the GPA range in high school than they did in college; both groups saw fewer individual students with a college GPA in the 3.0—4.0 range. It is notable, however, that the size of the gap between  high school GPA and college GPA at the top of the range is smaller for the New Tech juniors than it is for the seniors (this will be highlighted later). And, while that gap continues to exist — albeit in the opposite direction — for seniors in the middle of the GPA range (1.5–3.0, it seems to disappear for juniors. At the bottom of the range, of course, more juniors than seniors earned a GPA below a 1.5.

The degree to which high school GPA and college GPA move together can be further illustrated in the following two scatterplots:

N=28, R=+0.65, r^2=0.418

N=28, R=+0.65, r^2=0.418

N=39, R=+0.84, R^2=0.705

N=39, R=+0.84, R^2=0.705

As previously reported, there was a strong positive correlation between high school GPA and college GPA for all dual enrolled students (r=+0.74). As this data shows, the correlation was higher for juniors (r=+0.84) than it was for seniors (r=+0.65). And, while I do not have the mathematical chops to tell you yet whether or not this difference (r=+0.19) is groundbreaking, I can only tell you that I find it encouraging.

As an educator, I strive to give students accurate information about their potential to succeed after high school. I find it satisfying to learn that our New Tech initiative may be increasing that accuracy. 

Time will tell whether or not this trend will continue. I don't want to make any broad claims about why our New Tech educated students' GPAs are better predictors of college success. I will, however, close with some wonders:

  1. I wonder what effect our measurement of skills (collaboration, agency, oral & written communication) in addition to content is having on high school success as it relates to college success? 
  2. I wonder if this trend will continue with our next group of New Tech students who dual enroll? Specifically, I wonder if the model will apply equally to lower high school GPA-earning students?
  3. I wonder if other New Tech high schools have found similar results. 
  4. I wonder if I will be satisfied if the only quantifiable difference between our New Tech educated students' college success and those students taught in our traditional high school is this increase in our ability to predict said success? I wonder if our community would be satisfied?
  5. I wonder what questions I'm not asking that may have compelling answers in this data?

Our New Tech students are taking the ACT for the first time next week. We will also begin scheduling our second group of Early College participants. I can't wait to add this data to the mix for further analysis to see how they compare.

The Problem with Boys

As previously mentioned, my high school is now dual enrolling more students than ever — about ten times more. A quarter of all juniors and seniors took half their classes at the community college last semester as part of our early college efforts.

By most measures, these students did very well. As a group, they earned over 95% of the credits they attempted with an average GPA over 3.0. They were, after all, able to dual enroll because of their past performance on standardized tests and high school coursework. They went to college because we thought they were "ready."

Yet, unsurprisingly, not all students performed equally well. About 15% of our dual enrolled students ended the semester with a college GPA below a 2.0.  A few students even experienced their first academic failure in college. So, even within our high average of success, not all students shared the same experience. 

First Semester 2014-15 Dual Enrollment GPA Distribution (N=67)

First Semester 2014-15 Dual Enrollment GPA Distribution (N=67)

We consider this fact — that some students didn't do as well as expected — to be a really big deal. It means that our algorithm for credentialing students for college readiness isn't yet perfect. To be clear, we didn't expect it to be, and while we acknowledge that reaching "perfect" isn't probable, wanting perfect gives us reason to dig into our data in hopes of finding some clues that will help us identify relative risk in the future.

Our biggest takeaway?

Boys did much worse in college coursework than girls — a whole grade point worse, on average.

Girls earned college GPAs that were 1.05 points higher than boys, on average.

Girls earned college GPAs that were 1.05 points higher than boys, on average.

This is despite the fact that girls and boys performed equally on both the COMPASS and ACT assessments, which we use to determine eligibility for college-level coursework. We're talking less than 0.01 difference between boys and girls on these tests.

Being a boy had a stronger negative effect on student success than any other factor: free/reduced status, high school GPA, etc. At the same time, these factors still added to the risk — going to college as a boy receiving free lunch with a high school GPA below 3.0 was clearly tough — these students earned an average GPA below 1.5 in college.

The average college GPA for girls receiving free lunch with a high school GPA below 3.0: a respectable 2.5.  

What now?

We certainly can't increase our requirements for boys above that of girls without raising some eyebrows. What we can do is educate parents and students on the relative risks of going to college and how our data should inform that risk. While hope will likely spring eternal for most, some students may delay college entry in hopes of better results down the road.

We can also raise our expectations overall since doing so would result in sending fewer students with high school GPAs below 3.0. Even though most boys saw their GPA decline in college, the decline was less detrimental on students that started college with a high school GPA that was above 3.0. This seems obvious. It is good to have data to back this up now.

Lastly, I think it's crucial that we think of new ways to support students, specifically these struggling boys, while in college. To do this appropriately, we're going to have to get to know our boys a bit better to start to decipher what is going on. Is it maturity? Is it social expectations? Is it video games? We need to learn more about what is going on with them so that we can build in better supports for them to be successful.

Predicting College Success

I spent my morning analyzing the grades of the sixty-seven juniors and seniors who dual enrolled from my school this past semester. Of the 464 college credits attempted, 440 were earned, giving us a pass rate just a hair under ninety-five percent. Half the group had a college GPA above a 3.43. I'd say this is pretty good news for our first cohort of New Tech students taking college classes.

One of the goals of my analysis was to assess how well we predicted college readiness amongst these young advanced students. While only four of the sixty-seven students who dual enrolled experienced failure, some students still performed worse than expected. Pushing students to college too early could potentially blemish their college transcript. Defining "ready" has therefore become a really big deal.

Aligning our thinking with both our college partner and the state, we placed the greatest weight on students' college entrance exam scores last year. In deciding who got to go, we let test scores trump all other valid readiness indicators such as high school GPA, teacher perception, etc.

So, how did that work out for us?

The worst predictor of student success for us was their score earned on the COMPASS, taken by our current juniors who had not yet taken the ACT. The COMPASS is used by our community college partner to place students into courses at appropriate levels. For us, it turned out that the COMPASS provided only a minor ability to predict college success (r=0.25).

The correlation between student COMPASS scores and college GPA was a low r=+0.25.

The correlation between student COMPASS scores and college GPA was a low r=+0.25.

Coming in second was the ACT assessment, taken by all juniors in the state of Michigan. The ACT proved to be a fair predictor of college success (r=0.44).

The correlation between student ACT scores and college GPA was a moderate r=+0.44.

The correlation between student ACT scores and college GPA was a moderate r=+0.44.

The best predictor of college success turned out to be student GPA (r=0.76).

The correlation between student high school GPA and college GPA was a high r=+0.74.

The correlation between student high school GPA and college GPA was a high r=+0.74.

While the state of Michigan allows schools to use varied methods of determining college readiness before allowing students to dual enroll, it is interesting that they will not not allow GPA be a primary determining factor, given it's apparent ability to correctly predict student success.

What we will most likely do in the future, given this data, is create a single numerical value for each student that takes into account their college entrance exam score and their high school GPA. This would appear to provide some additional predictive ability (r=+0.82 to r=+0.86) not possible using test scores alone.

UPDATE—January 30, 2015: Looking at this with fresh eyes, I think it's important to point out that we used the minimum COMPASS and ACT scores required for college-level coursework placement with our community college partner as our cutoff for allowing students to dual enroll. We did not use the state minimum scores, which are higher. It is logical that using the higher scores would have increased these assessments' predictive ability. We are choosing to use the lower scores to increase access with the hope of keeping risk to a minimum for our students.

We Still Don't Know the Difference Between Change and Transformation

Ron Ashkenas, writing for Harvard Business Review:

Unlike change management, [transformation] doesn’t focus on a few discrete, well-defined shifts, but rather on a portfolio of initiatives, which are interdependent or intersecting. More importantly, the overall goal of transformation is not just to execute a defined change — but to reinvent the organization and discover a new or revised business model based on a vision for the future. It’s much more unpredictable, iterative, and experimental. It entails much higher risk. And even if successful change management leads to the execution of certain initiatives within the transformation portfolio, the overall transformation could still fail.

While his audience is clearly the business community, the above statement speaks volumes to educators just the same.

A Teenager's View on Social Media

Insightful article by "actual teen," Andrew Watts:

If I could break down a party for you in social media terms, here’s how it would pan out:

  • You post yourself getting ready for the party, going to the party, having fun at the party, leaving at the end of the party, and waking up the morning after the party on Snapchat.
  • On Facebook you post the cute, posed pictures you took with your friends at the party with a few candids (definitely no alcohol in these photos).
  • On Instagram you pick the cutest one of the bunch to post to your network.

Snapchat is where we can really be ourselves while being attached to our social identity. Without the constant social pressure of a follower count or Facebook friends, I am not constantly having these random people shoved in front of me. Instead, Snapchat is a somewhat intimate network of friends who I don't care if they see me at a party having fun.